
Gallery of ARTEMeS displays
ARTEMeS is a software system that provides the link between an instrument that measures some environmental parameter, and the user who needs access to that measurement. This link is designed to be flexible, allowing the use of almost any instrument or measurement type; and mathematically sound, so that any particular handling requirements of the parameter are obeyed. ARTEMeS features interactive displays to provide the user with essential additional information about each measurement.
ARTEMeS displays were originally written as Java applets, a technology which allows highliy interactive and complex
components to be embedded in web pages.
Java applets offer the best user experience and integration with the web page, however, with the continuing diversification
in web browsers and devices capable of viewing the Internet support for Java applets is becoming less common.
Display components may also run as server-side processes, where a regularly-updated image is delivered to the browser.
This gallery shows full-size images of the displays.
Users having browsers that support Java applets may view applets instead of the images by clicking on the link on each page.
Components may also be run as standalone applications, to users who have Java installed. The applications use Java Native Launch
Protocol (JNLP, or Web Start), and offer all the interactivity and functionality of Java applets. Each page in the gallery has a
link which will start the standalone application.
Standalone display applications for Android are currently under development.
ARTEMeS is under active development. This page and the following pages as well as the displays shown are subject to change and improvement.
Each of the thumbnail images below show an example ARTEMeS display type.
Click on the images to access a page showing a full-size image and fully-functional working display.
|
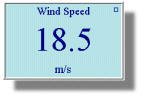
Point Value Point Value displays generally show the most recent value of a parameter. |
|
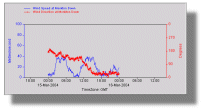
Time Series A Time Series is a graph showing how the value of a measured parameter has varied with time. |
|
Photograph Sequence The Photograph Sequence Display allows a user to view a time sequence of photographs as an animation. |
|
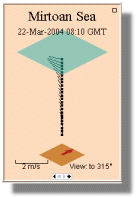
3D Current Profile Portrays a time series of current profiles as an animated, rotatable, 3D vector plot. |
|
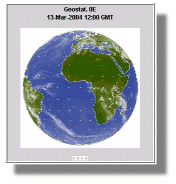
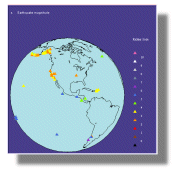
Rotatable Globe Display Shows measurements from different locations as a rotatable globe. |
|
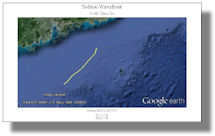
Soliton wavefront forecasting Shows animated time series of soliton wavefronts on a fixed basemap. |
|
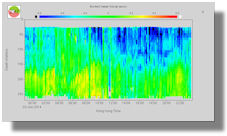
Colour Slice Display Shows a profile of currents as colours. This example plots current velocities resolved along an adjustable axis. |
|
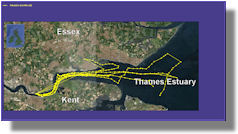
Geographical Display Shows vessel tracks on the River Thames. |
NOTICE
The displays that appear on the following pages are intended to demonstrate the interactive nature of the displays, not to
provide accurate measurents. Some of the values shown are live from a real weather station; while others are taken from
public-domain sources on the Internet.
Many of the displays, however, are showing historical data that has been time shifted and attributed to a different location
in order to preserve confidentiality.
