Globe Display
| |||
Data copyright © USGS 2019 |
Enable applet support
Click here for interactive version.
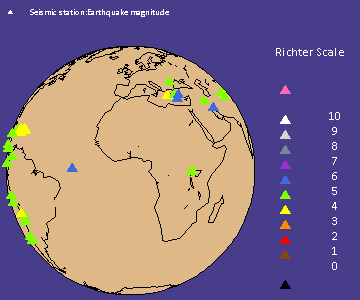
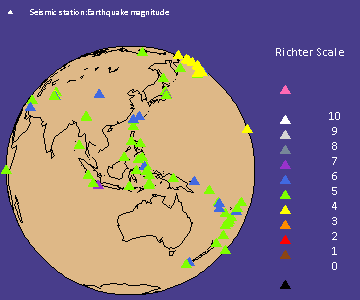
The globe display shown on this page is plotting time Earthquake information from the US Geological Survey. The data forms a timeseries of events each comprising a location and earthquake magnitude. Coloured symbols representing earthquake magnitude are plotted on a map projection at the correct location.
Several different map projections are available; this display uses an orthographic projection. The coastline used is derived from the public-domain CIA World Data Bank II file.
The display shown on this page is a static image of the earthquake time series up to the present, generated on the server each time the page is requested.
A full interactive version of the display is available by clicking on the link if Java is installed. It will load as a JNLP (Web Start) application.
Interactive display features
The full display shows a time series of earthquake events, plotted on a whole-Earth projection of the globe. Like all ARTEMeS displays, the plot offers a degree of user interaction to provide additional information and enhance the user's viewing experience.
- Clicking on the parameter name (Seismic station: Earthquake magnitude) allows the measurement's metadata to be viewed.
- Dragging the mouse over the globe will rotate the view
- Pressing the mouse in the centre of a symbol will show the TimeSeries
Inspector
Note how the Inspector shows three different types of data: location, magnitude and a text field.


